Updated for April 2025: When we were developing the Professional Scrum with Kanban guide and class, Daniel Vacanti kept insisting I inspired the Work Item Aging flow metric we introduced. I was complimented, but didn’t recall the exact reference. Well, it turns out I did write and talk about this.
A Confession. While I’m a great fan of using SPC charts to explore specific cycle times and reduce variation / continuously improve a Kanban System (a great blog by Benjamin Mitchell), I’m only seeing preliminary results in the field with teams I’m coaching. The primary reasons are a lack of tooling, a lack of incentive to manage this manually, and the fact that teams are not yet mature enough to handle it effectively. I’m hoping this will change soon.
With that in mind, a constant concern I’m hearing is that finding out that there was an exception based on SPC is too late. Why is that? Because a classic SPC looks at final cycle time. And Final by definition means the action is over…
A couple of months ago, I read about “average cycle time in column” in the GSK R&D Case Study by Greg Frazer.
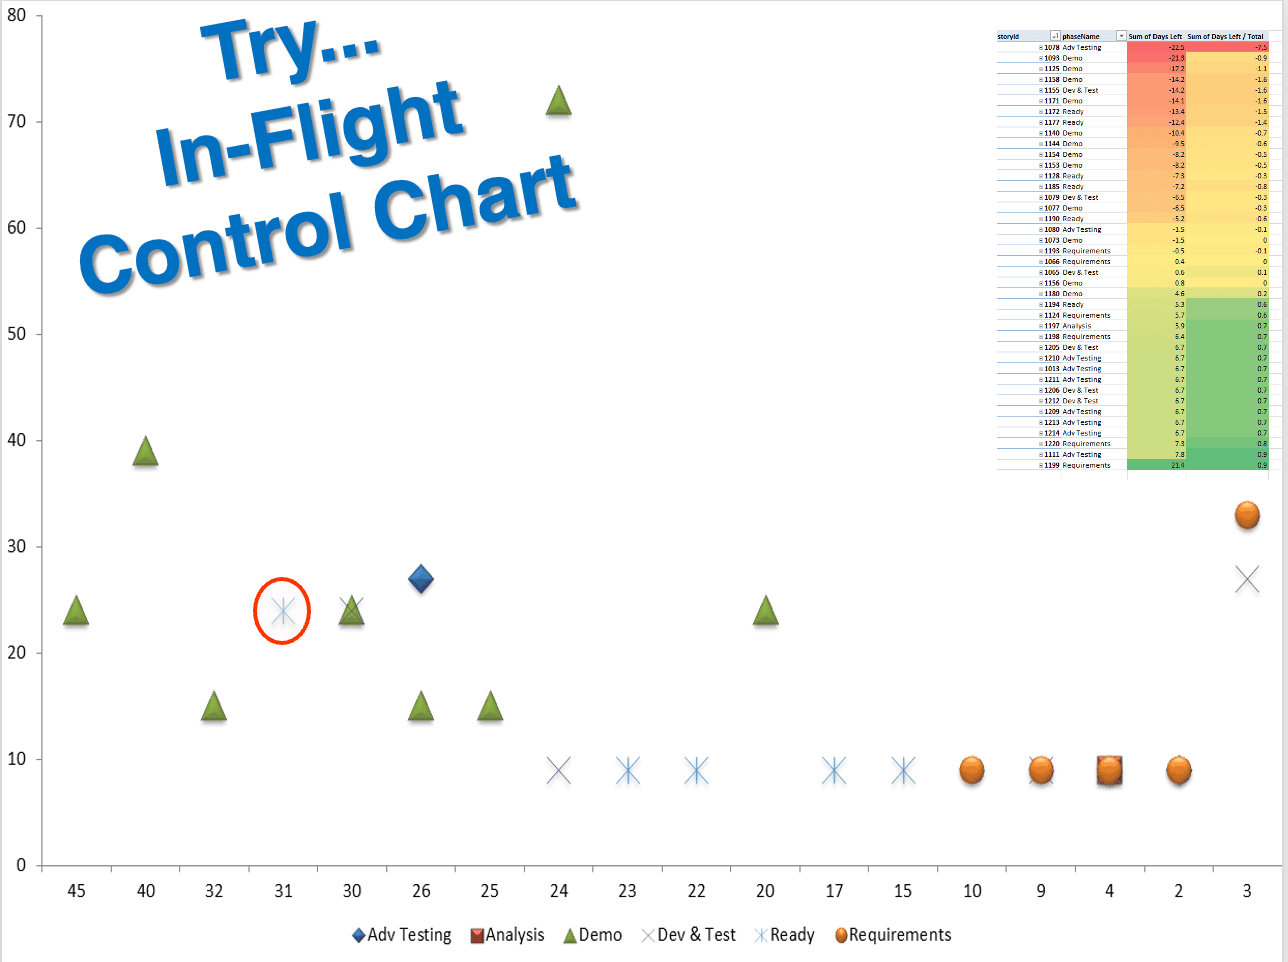
A couple of days ago, I had the idea that perhaps using the collected history of cycle times in columns/lanes, a current prediction of final cycle time can be calculated for each card in the system. This prediction can be then traced on an SPC-like chart, and exceptions can be identified more clearly (see illustration below for an example)

This reminds me of charts used to track “Due Date Performance” on releases/milestones, which I saw at one client of ours. I later learned they are called Slip Charts
The main difference is that the SPC Y-axis is by cycle time length. In the Due Date tracking chart, it’s by actual date. I think it’s probably sufficient to just rely on the SPC charts. I would urge organizations that track due date performance on releases and milestones to start implementing SPC at that level, even if they don’t use Kanban or Agile at the feature or story level. They might learn a few things that can help them bring their process under control and improve their predictability.
Back to the predictive SPC – no tool that I’m aware of currently offers this capability, but one can always hope.
I see capabilities such as identifying struggling work items based on exceptions from “average time in lane” as well as overall exception in predicted cycle time, key to taking the “early feedback and action” one step forward, and scaling Kanban to be something project managers swear by. If you are aware of any Kanban tools that offer this feature, I would be happy to hear about them.
Update: I’m glad to report that over the years, tool vendors listened and provided a variety of ways to identify aging work items. Whether it’s Actionable Agile Analytics and its robust Work Item Aging report, Leankit and its filters, or tools like JIRA / Trello that can highlight aging work items visually.