Improving Portfolio Flow Using Flow Metrics
Flow metrics — cycle time, throughput, WIP, aging — aren't just for team-level Kanban. How to apply them at the portfolio level to visualize investment flow and make smarter prioritization decisions.
 Click image to open full size
 Flow metrics make portfolio conversations harder to avoid
So you have a Portfolio Kanban board for your biggest investments. You are using it in portfolio conversations, and leaders can finally see the work in flight. That is a good start, but it is still easy to explain away the mess when the only evidence is a busy board.
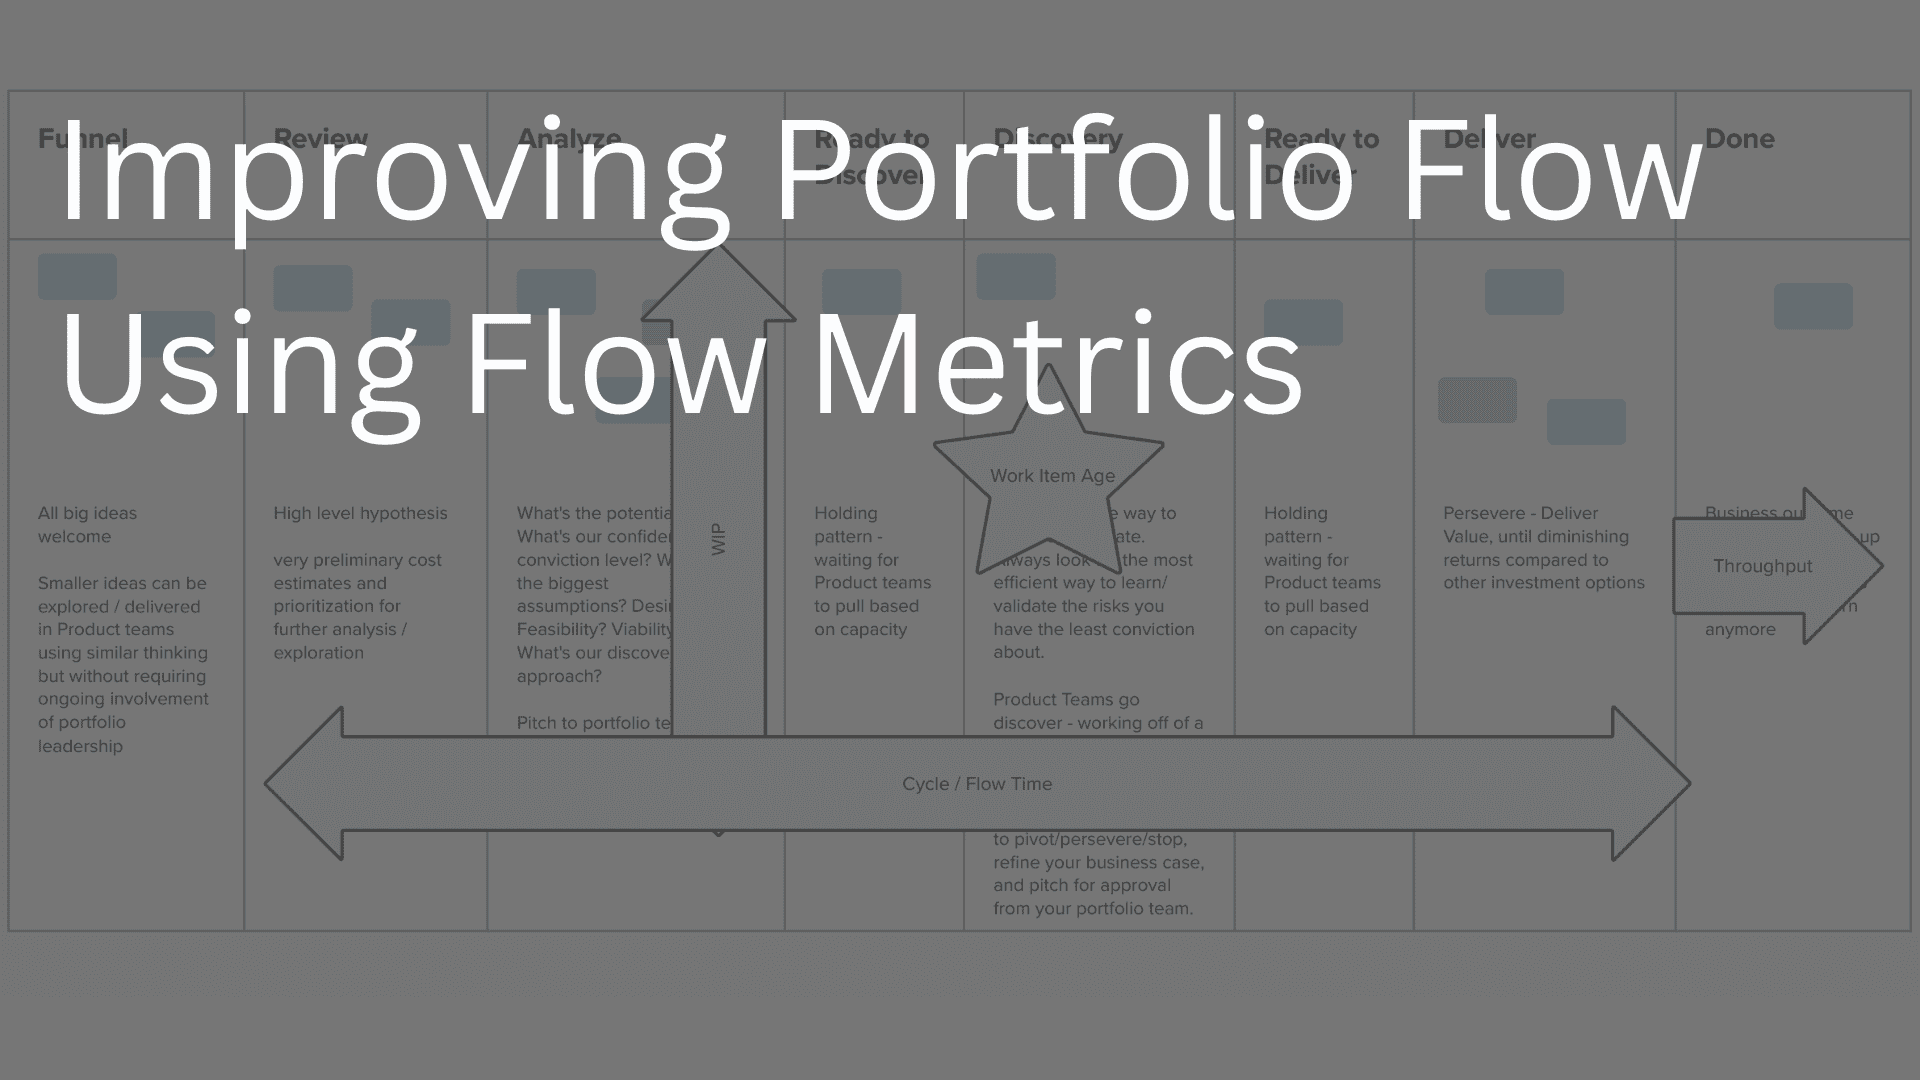
Kanban and flow metrics sharpen the conversation. The four flow metrics from the Kanban Guide are Work in Process (WIP), Cycle Time, Throughput, and Work Item Age. They are useful at the team level, but they may be even more useful at the portfolio level because the cost of fooling yourself is so much higher.
WIP is the number of active investments. You can see it by looking at the board, but measuring it over time makes the pattern harder to ignore. Count items in each stage, and also look at the total investment size currently in process. The hope is that the data says what everyone already suspects: too many things are in flight, and something has to change.
Cycle Time for portfolio investments is usually measured in months, not days. It tells you about time to learn and time to market. Over time, you can establish a Service Level Expectation (SLE) that helps leaders reason about how long investments of this type tend to take, instead of planning every item as if it were special.
Throughput counts how many investments are finished in a period. It does not care about size. In most portfolio workflows, “finished” means the work is no longer treated as a high-profile investment and has moved back into business as usual. If your throughput is three investments per quarter, that should change how many new investments you allow into consideration.
Work Item Age shows how long each active investment has already been in process. That makes it a leading indicator. Even for long-horizon portfolio work, age helps identify anomalies: investments that are quietly drifting, blocked, or no longer worth the capacity they are consuming.
If you have historical data, you can reverse-engineer these metrics to establish a baseline faster. That data can be useful when leaders need to see that the portfolio is more swamp than river.
One warning: flow is the right place to start, but it is not enough. Better flow matters because it should help you learn faster, reduce waste, and improve outcomes. If flow metrics only make the reporting prettier, you missed the point.
If your portfolio flow is visible but still not changing decisions, explore the Portfolio Agility advisory path.
Practical thinking on turning AI pilots, adoption, and portfolio work into business impact - by finding the constraint, changing the work, and proving value as you go.
Yuval Yeret helps product and tech leaders move from agile theater to evidence-informed delivery. Work with Yuval →