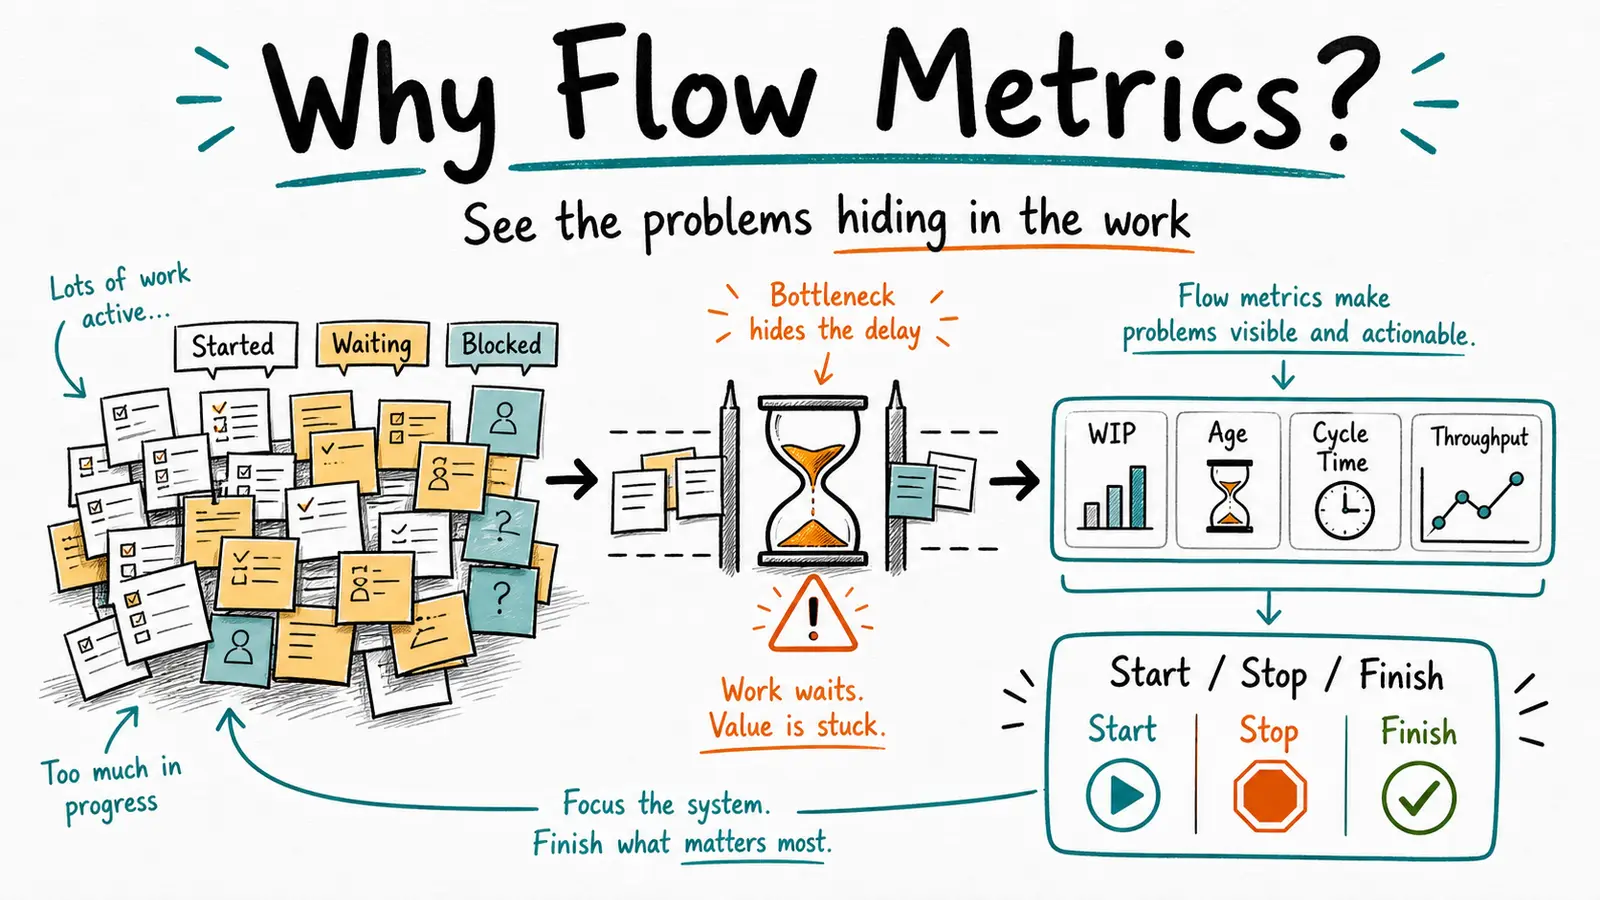
Why Focus on Flow Metrics? The Problems They Help You See
Flow metrics are not useful because metrics are good. They are useful when important work is slow, blockers show up late, forecasts are fragile, and leaders need a better way to decide what to start, stop, finish, or fix.
 Click image to open full size
 Start With The Expensive Problem
Most teams do not wake up one morning wishing they had better flow metrics. They wake up frustrated because everything feels busy, but important things still take too long. Leaders ask for a forecast and get a mix of confidence theater, story points, and “it depends.” Teams say they are blocked, but the blockers show up late, after the date has already slipped. Priorities keep changing because the organization keeps learning too late that the current plan is not going to work.
That is usually the better place to start. Do not start with “we need WIP, cycle time, throughput, and work item age.” Start with the expensive problem. Flow metrics are useful when the problem is hiding in the movement of work. They help you see where work waits, where it ages, where it piles up, where it finishes, and whether the system is becoming healthier or just louder.
Start before the principle
I like principle-based assessments because they avoid one of the worst habits in agile improvement: checking whether people perform the mechanics while ignoring whether the organization is getting better. That is the idea behind my Principle-based Agility Assessment. It is meant to move the conversation away from “are we doing the process correctly?” and toward “are we developing the behaviors that make us more agile?”
But even principles can be too far downstream.
“Focus on flow” is a good principle. “Reduce work in progress” is a useful direction. “Manage work item age” can be a powerful practice. But a leader who is not already in the flow conversation may still ask a fair question: why should I care? The answer should not be “because flow is good.” The answer should be tied to a problem they recognize.
Maybe too many things are active and too few are finishing. Maybe every meaningful initiative depends on the same platform team, architect, security reviewer, legal person, data scientist, or executive committee. Maybe the roadmap is full, but customers are still waiting for the thing that matters. Maybe the organization is spending more time coordinating work than doing it. Maybe the portfolio looks strategic on slides and chaotic on Monday morning.
Those are the problems that make flow worth caring about.
When everyone is busy but nothing important finishes
One common symptom is the “busy but stuck” organization. Everyone is loaded. Every team can show progress. Every initiative has an owner. The status report is full. But the few things that matter most move slowly, and by the time they reach the finish line, the business context has changed.
This is where WIP becomes more than a metric. It becomes a mirror.
WIP shows how many things are started but not finished. At team level, that might mean stories, defects, experiments, or service requests. At portfolio level, it might mean initiatives, investments, product bets, or major cross-functional changes. The number itself is not the point. The conversation it creates is the point.
If WIP keeps growing, the organization is starting faster than it is finishing. That usually means longer lead times, more context switching, more stale work, more coordination, and more work that needs to be re-explained every time someone comes back to it. This is why “stop starting, start finishing” lands so well. It names the problem in plain English. Flow metrics help you see whether you are actually doing it.
When forecasts are mostly hope with formatting
Another symptom is forecast pain. The business asks reasonable questions: What is likely to finish this quarter? Can we launch this before the customer event? Which roadmap items are realistic? Are we on track, or are we just still busy?
Many organizations answer those questions with commitments, points, confidence votes, or delivery dates that mostly depend on who is in the room. Then the work starts, dependencies appear, queues grow, and the forecast turns into a negotiation. Flow metrics do not create certainty. They make uncertainty harder to ignore.
Throughput tells you how much work the system tends to finish in a period. Cycle time tells you how long similar work tends to take once it starts. Work item age tells you which active items are already becoming risky. WIP tells you whether the system is stable enough for any forecast to mean much.
That last part matters. If WIP is out of control, item sizes are wildly inconsistent, and dependencies dominate the work, a forecast built on top of that system will still be shaky. The metric did not fail. The metric showed you that the system is not forecastable yet. That changes the conversation from “who gave us the wrong date?” to “what about our system makes dates this fragile?”
When blockers show up too late
Teams often know work is stuck before the official reporting system admits it. The card has not moved. The pull request is waiting. The experiment is waiting for data. The design is waiting for review. The initiative is waiting for the same decision that blocked three other initiatives. But until someone names it as blocked, it can sit there looking normal.
Work item age helps here. Age is the elapsed time since an item started. It is useful because it focuses attention on active work before it becomes another disappointing cycle-time data point after the fact.
At team level, an aging item might mean a story is stuck in development, review, testing, or product clarification. At portfolio level, an aging initiative might mean the investment has been active for months without reaching a decision, a launch, or a meaningful outcome signal. The best use of work item age is not to shame anyone. It is to decide what to do: swarm it, split it, remove a dependency, get a decision, narrow the scope, pause it, or stop it.
That is a very different conversation from “please update your status.”
When the same people are involved in everything
Flow also exposes structural problems that status reports hide. If the same team appears on 80 percent of portfolio cards, you do not have a prioritization problem only. You have a constraint. If every meaningful product change needs the same architecture group, platform team, data approval, legal review, or leadership decision, the flow of work will be governed by that constraint whether you admit it or not.
This is where flow connects to product operating model, portfolio agility, and organizational design. Sometimes the next move is not “make the constrained team work harder.” It might be to reduce the number of active initiatives touching that group, change sequencing so the constraint works on the most important work first, invest in self-service platforms, move decision rights closer to the work, or reshape product boundaries so fewer initiatives need cross-team choreography.
Flow metrics do not make those decisions for you. They make the cost of avoiding those decisions harder to miss.
When the portfolio has too many good ideas
Flow problems are not always caused by bad work. Often they are caused by too much good work. This is especially visible at portfolio level. Every initiative has a sponsor. Every initiative has a rationale. Every initiative can be defended. The problem is that the collection of active initiatives is too heavy for the organization to carry.
A busy portfolio Kanban tells a story. Sometimes it tells you that leadership is still managing too many decisions centrally. Sometimes it tells you that your product architecture creates too much cross-product dependency. Sometimes it tells you that the organization is better at approving work than finishing it. Sometimes it tells you that the portfolio is a swamp pretending to be a roadmap.
The flow move is to review right to left. Start with what is closest to done. Then look at what is stuck. Then ask what should be accelerated, descoped, paused, or stopped. Only after that should you ask what new work deserves to enter. That one habit changes the room. It makes starting new work feel less innocent because everyone has just looked at the unfinished work already asking for attention.
When local improvement does not improve the business
Flow metrics are also useful when one part of the organization is getting faster, but the business is not. This shows up a lot now with AI-assisted work, but it is not only an AI problem. Engineering can get faster while product discovery, review, release, adoption, customer onboarding, or leadership decision-making becomes the real constraint. Marketing can produce more campaigns while approvals or sales follow-up becomes the bottleneck. Product can generate more ideas while teams are still drowning in old commitments.
Local speed is seductive. End-to-end flow is more honest.
The question is not “which team got faster?” The question is “which business constraint moved?” Did a customer get value sooner? Did a costly delay shrink? Did a decision improve? Did a queue get shorter? Did the organization learn something earlier while it was still cheap to change direction?
Flow metrics help connect local work to those system questions. They are not the whole answer, but without them many organizations keep celebrating motion while the constraint stays exactly where it was.
What the four flow metrics are really for
Here is the plain-English version. WIP tells you whether you are trying to do too many things at once. Cycle time tells you how long work actually takes once it starts. Throughput tells you how much work actually finishes. Work item age tells you which active work is becoming risky right now.
Together, they help with three leadership conversations:
- Focus: Are we starting more than we can finish?
- Predictability: What can we honestly expect from this system?
- Intervention: Where should we act now because work is aging, waiting, or piling up?
That is why I would not position flow metrics as a measurement program. Measurement programs often become their own theater. I would position them as a way to have better operating conversations. If the metrics do not change what you start, stop, accelerate, split, descope, or decide, they are probably not helping yet.
If you want the more detailed metric explanation, I cover WIP, cycle time, throughput, and work item age in Flow Metrics for Scrum. I also wrote about applying the same logic at portfolio level in Improving Portfolio Flow Using Flow Metrics.
A simple way to decide whether flow metrics are worth it
Ask these questions:
- Do we have more important work active than we can reasonably finish?
- Do we often discover blockers late?
- Do our forecasts depend more on optimism than on historical flow?
- Do priorities shift because old work takes too long to finish?
- Do the same people or teams become the bottleneck across many initiatives?
- Do we struggle to tell whether the system is improving?
- Do leaders spend more time asking for status than making decisions that improve flow?
If several of these are true, flow metrics are probably worth exploring. You do not need a massive rollout. Pick one real workflow. Decide what work item you care about. Make the work visible. Track WIP, cycle time, throughput, and work item age lightly enough that people will actually use them. Then use the data in the meetings you already have.
The first goal is not perfect data. The first goal is a better conversation about why work is slow, what is stuck, what should finish next, and what should stop stealing attention.
That is why focus on flow.
A lightweight self-assessment prompt
You can use this prompt with ChatGPT, Codex, Claude, Gemini, or another assistant as a quick “is flow worth focusing on?” conversation. It is not meant to replace a full assessment. It is meant to start with the problem before jumping to practices.
AI Prompt
You are a pragmatic flow coach helping me decide whether flow metrics would be useful in my context, following up on the guidance at {url}. Start by helping me identify the major symptoms or friction areas I want to improve. Only then connect those symptoms to the flow metrics that might help me see the problem more clearly and make better operating decisions.
Context
Please prompt me to provide the following context if I haven’t already:
- Organization or team:
- Type of work that might flow:
- Level: team / product group / portfolio / business process
- Current improvement goal:
Instructions
Run this as an interactive coaching conversation, not a survey. Ask one or two questions at a time. Choose the next question based on what I say.
Phase 1: Name the Problem
Start by helping me name the expensive problem in plain language. Useful symptom areas to listen for include:
- Too much important work active at the same time
- Work waiting between teams, reviews, approvals, or decisions
- Unreliable forecasts or dates that turn into negotiations
- Blockers showing up late
- The same person, team, or group becoming a recurring constraint
- Priorities changing because older work takes too long to finish
- Teams looking busy while end-to-end value still moves slowly
- Leaders spending more time asking for status than making decisions that improve flow
Phase 2: Define the Workflow
Once the main friction area is clearer, help me define the workflow enough to reason about it:
- What kind of work are we talking about?
- Where does this work start and where does it finish?
- Who reviews or acts on the flow of this work today?
- Which existing meeting or cadence could use better flow information?
Phase 3: Hypothesize and Recommend
Use your judgment to form a hypothesis about which flow metric might help. Do not force all four metrics into the answer. Pick the smallest useful starting point.
Use this guidance:
- WIP (Work In Progress): Helps when the problem looks like too much active work, context switching, priority churn, or starting more than we finish.
- Work Item Age: Helps when stale work, late blockers, invisible risk, or stuck-but-not-called-blocked work is the main issue.
- Throughput: Helps when we need a more honest view of how much work the system actually finishes over time.
- Cycle Time: Helps when we need to understand how long work really takes once it starts, especially for similarly sized or similarly shaped work. As well as reflect and learn from special variation.
- WIP by Step or by Dependency: Helps when work waits in queues or keeps touching the same constrained team, role, approval group, or decision point.
Your job is not to sell me flow metrics. Your job is to help me decide whether a flow metric would make a real problem easier to see and act on.
References
Draw on the following concepts when coaching me:
- Why Focus on Flow Metrics?
- 4 Key Flow Metrics and How To Use Them
Output Format
Before giving a recommendation, reflect back:
- The main symptom or friction area I seem to care about
- The likely flow mechanism behind it, if one is visible
- What you are still unsure about
Then recommend a small next step. Favor a small experiment that fits an existing operating cadence (e.g. integrates into scrum events).
Format your final recommendation along these lines:
- The main symptom or friction area I want to improve: …
- The workflow we should inspect: …
- The likely flow mechanism behind the friction: …
- The flow metric I would start with and why: …
- The operating conversation or meeting that should use the data: …
- A small experiment to try for 2-4 weeks: …
- What would convince us to continue, adjust, or stop: …
Tone
Keep the tone direct and practical. Avoid agile jargon unless I use it first.
If flow metrics do not change what you start, stop, finish, split, or unblock, they are probably just another dashboard. The value is in the operating conversation they make possible.
Which flow metric should you start with?
If you are not sure where to start, or which metric makes the most sense for the friction you are actually feeling right now, I put together a quick scorecard. It takes a couple of minutes to fill out, and it will give you a concrete recommendation on what to measure first based on your specific situation.
Which Flow Metrics Scorecard
Take the free 2-minute diagnostic to find the right flow metric for your current organizational challenges.
Take the Scorecard →
Practical thinking on turning AI pilots, adoption, and portfolio work into business impact - by finding the constraint, changing the work, and proving value as you go.
Yuval Yeret helps product and tech leaders move from agile theater to evidence-informed delivery. Work with Yuval →